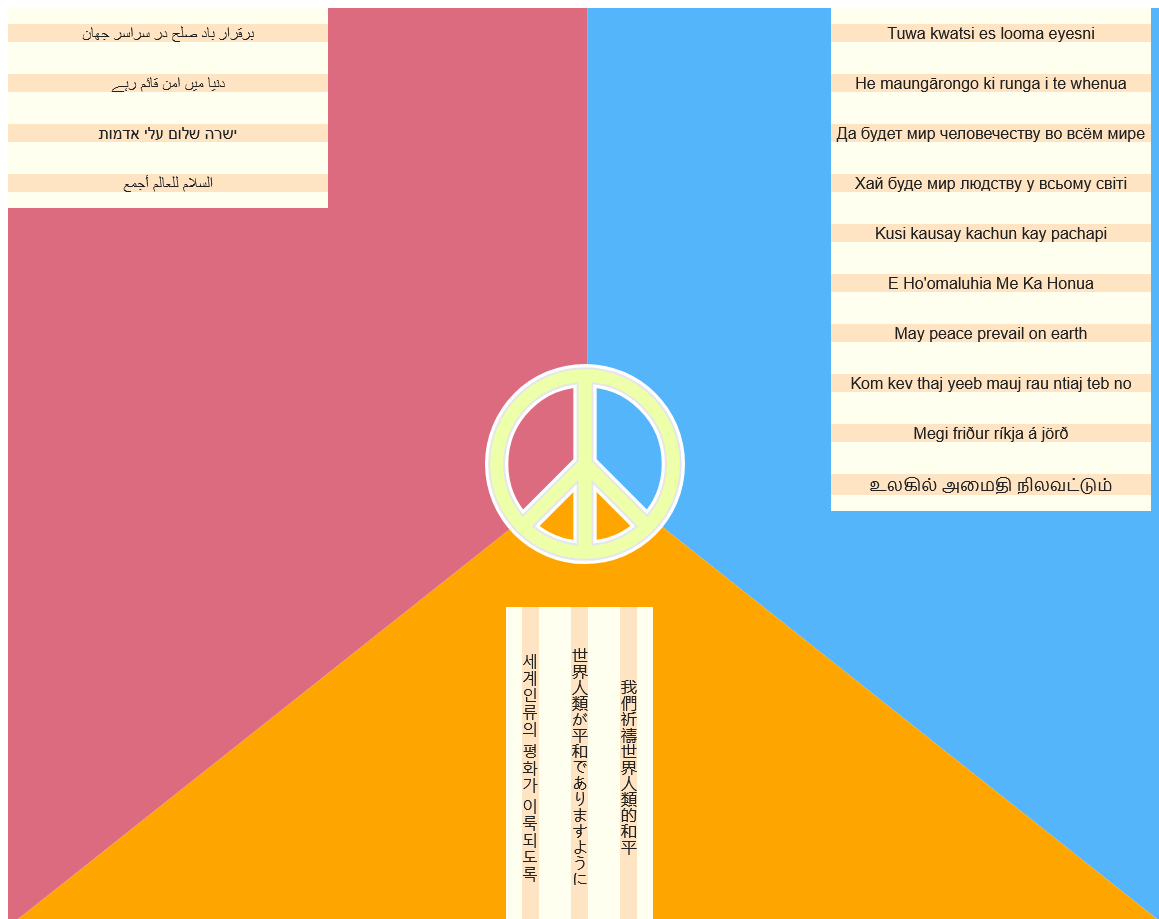
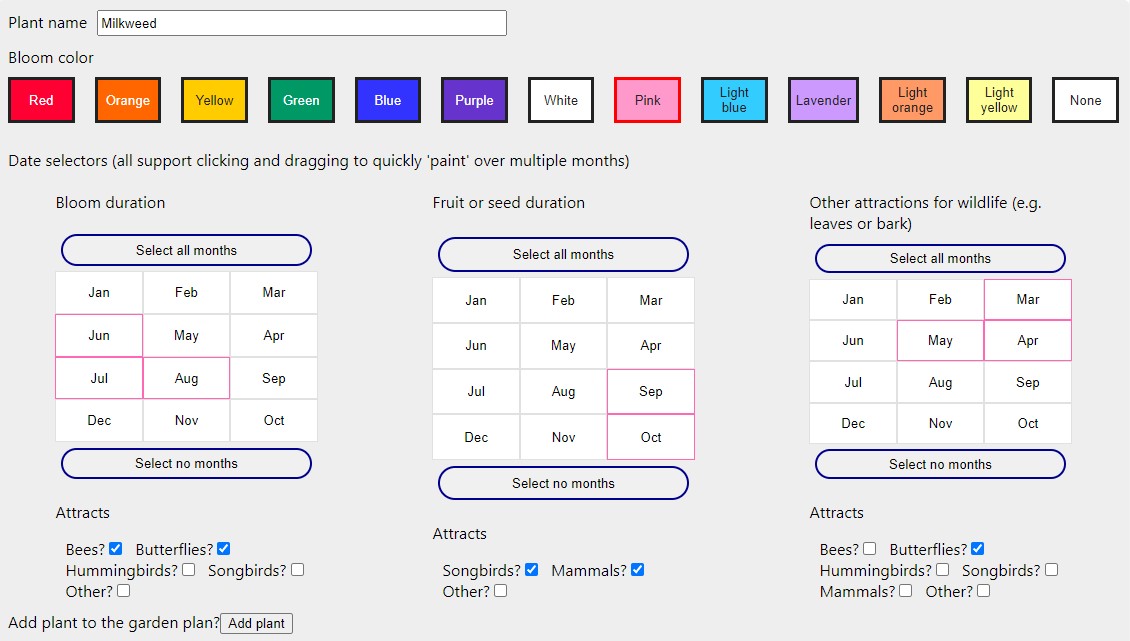
Wildlife garden planner
Made using React with Typescript
Input plant characteristics that attract wildlife (blooms, fruits/seeds, other). Get an intuitive plot of all the plant characteristics through a year to pinpoint time gaps where plants are not attracting wildlife. This lets the planting plan be modified to better attract wildlife.
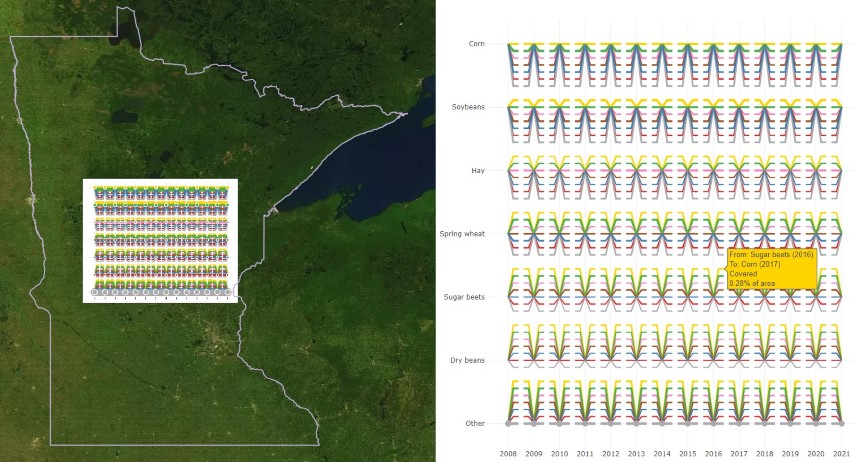
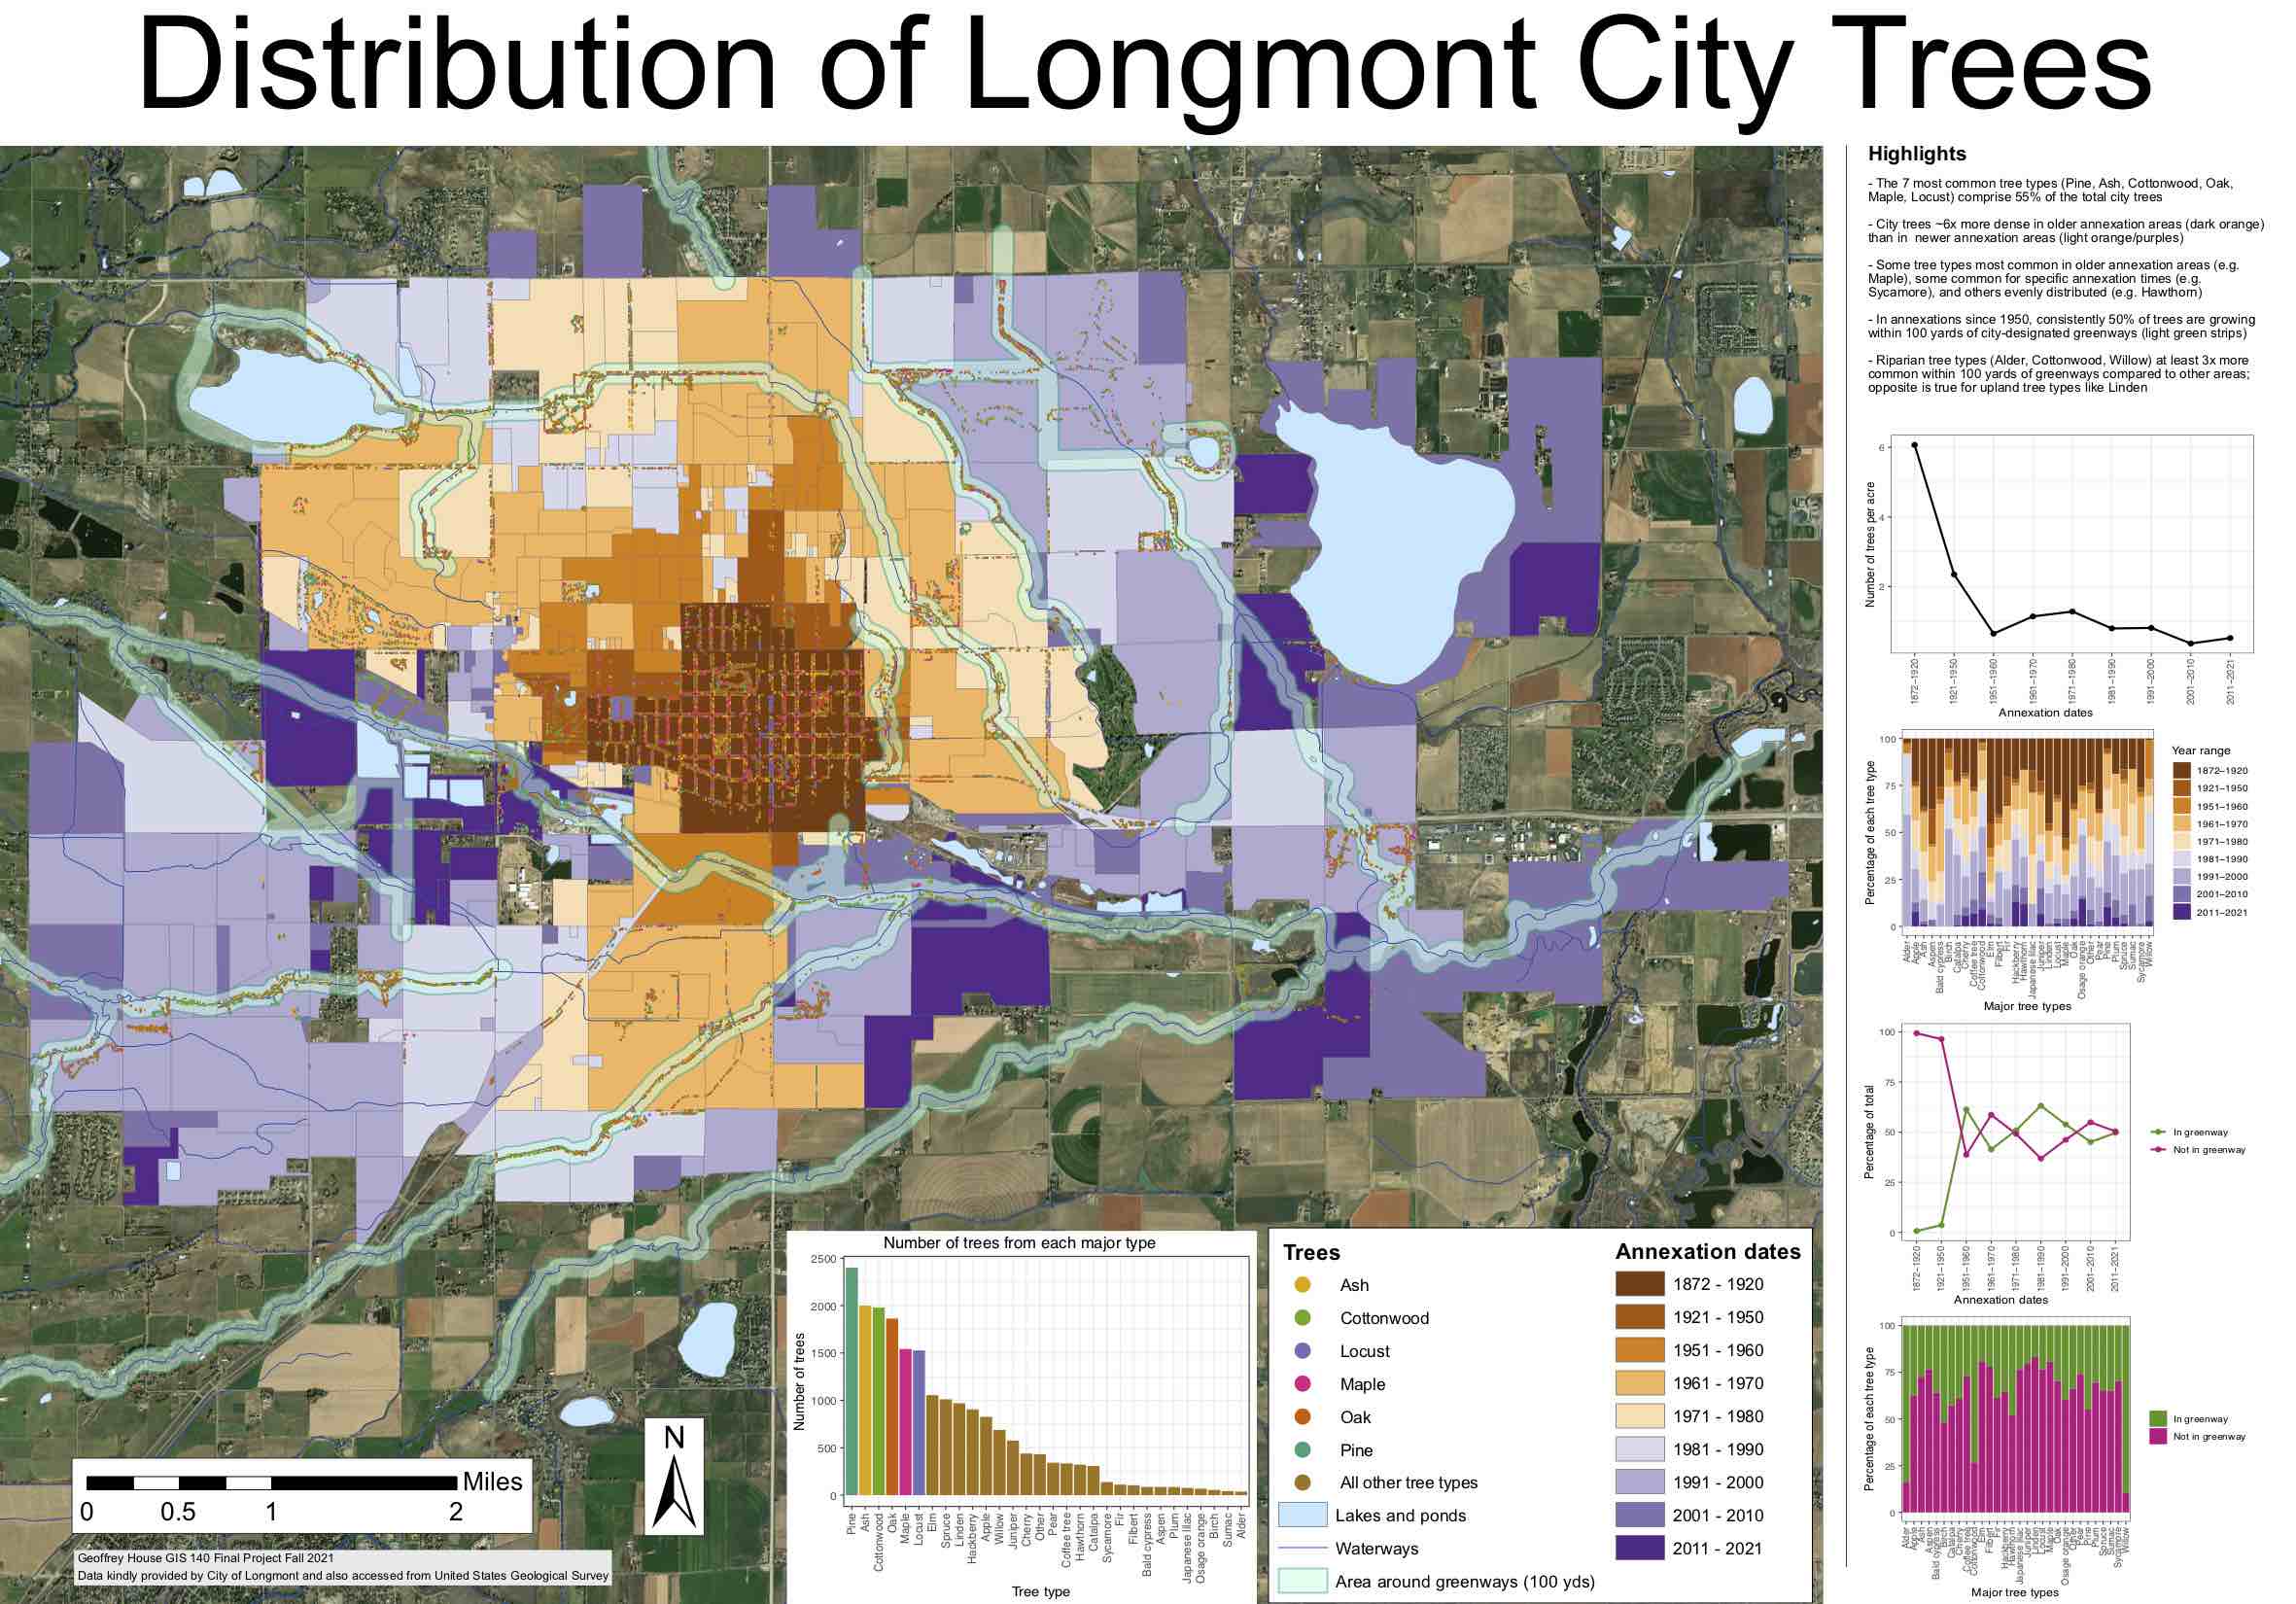
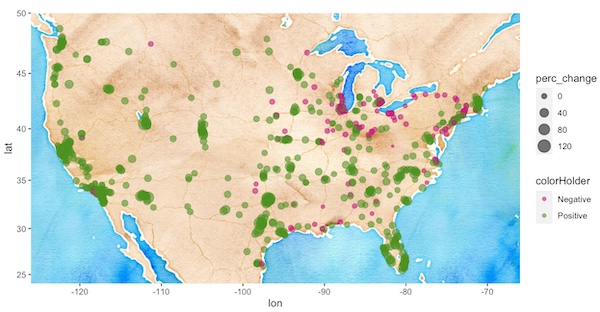
Visualizing crop rotations in Minnesota from 2008-2021
Made using Mapbox
Map contains thumbnail charts of crop rotations (corn, soy, hay, spring wheat, sugar beets, dry beans, and all other land uses) in Minnesota at the state and county levels from 2008-2021. Click on any chart to explore an interactive version of it with tooltips.
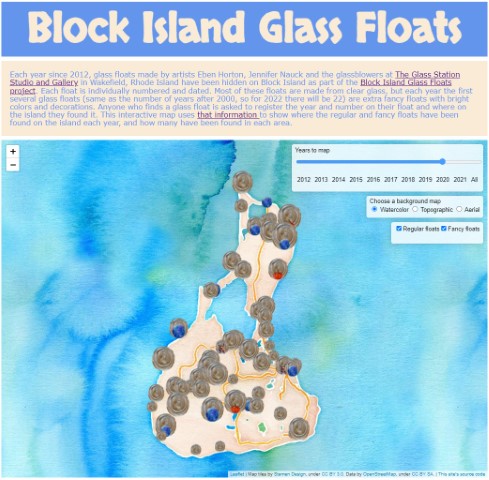
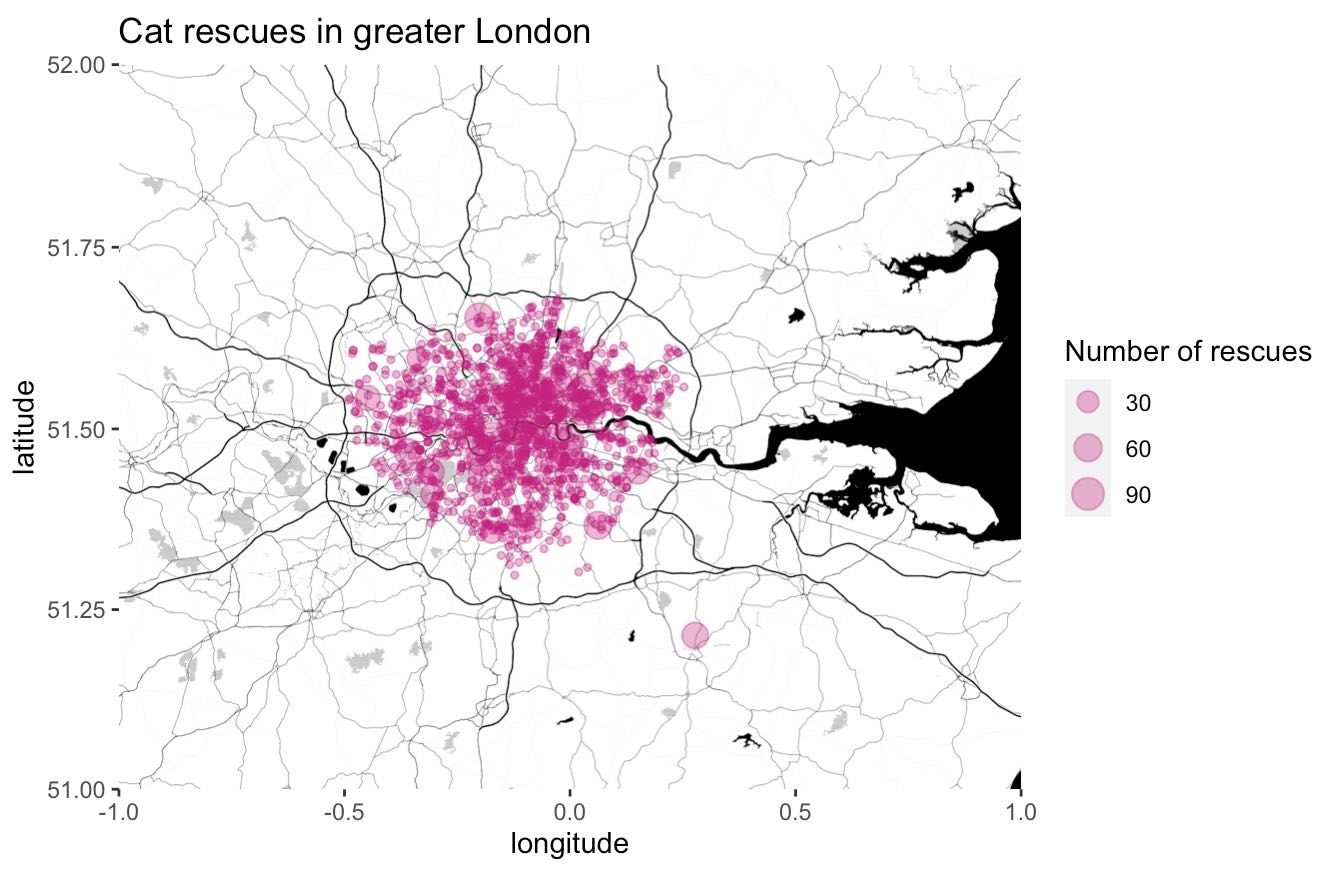
Locations of glass floats found on Block Island, Rhode Island
Made using JavaScript's Leaflet library
Interactive web map with data filtering and background selection to see where glass floats have been found on the island as part of an annual scavenger hunt since 2012.
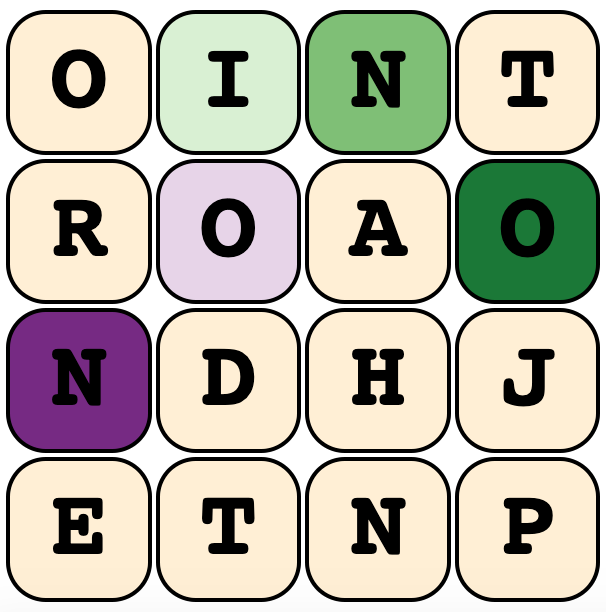
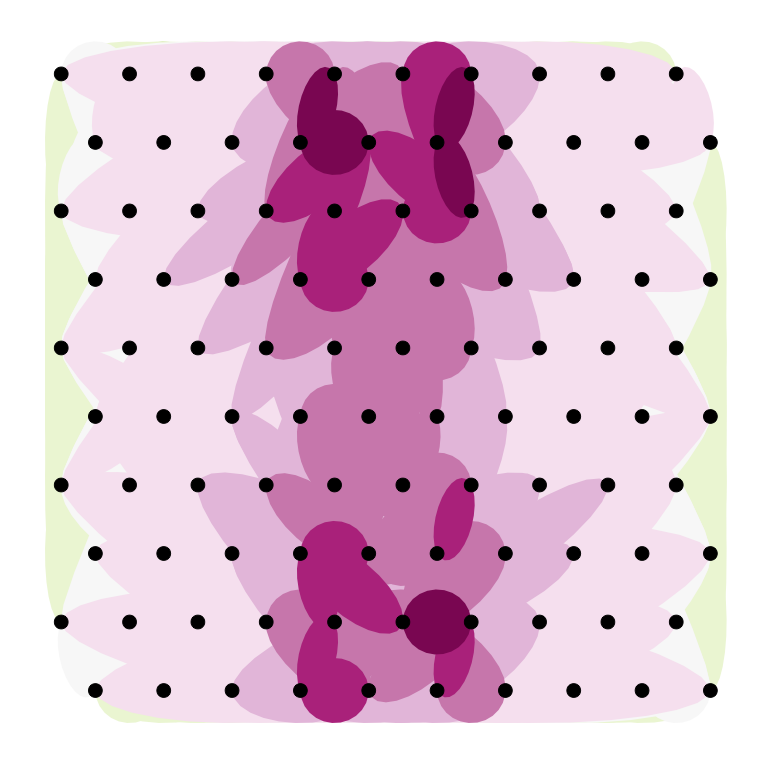
WordPath
Made using JavaScript
Find as many words as you can in the grid in 3 minutes with the integrated timer. When the time's up, you can display a list of all of the possible words in the grid. Clicking on the word in this list highlights its 'WordPath' in the grid from dark green (first letter) to dark purple (last letter). The number of vowels in the grid can be changed too.
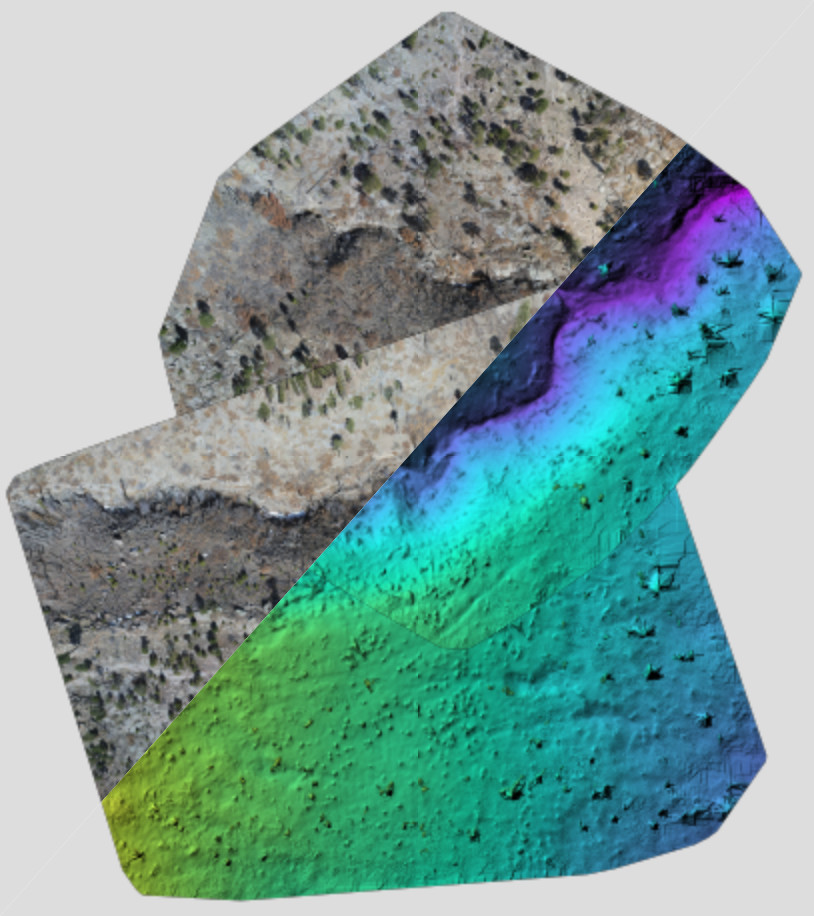
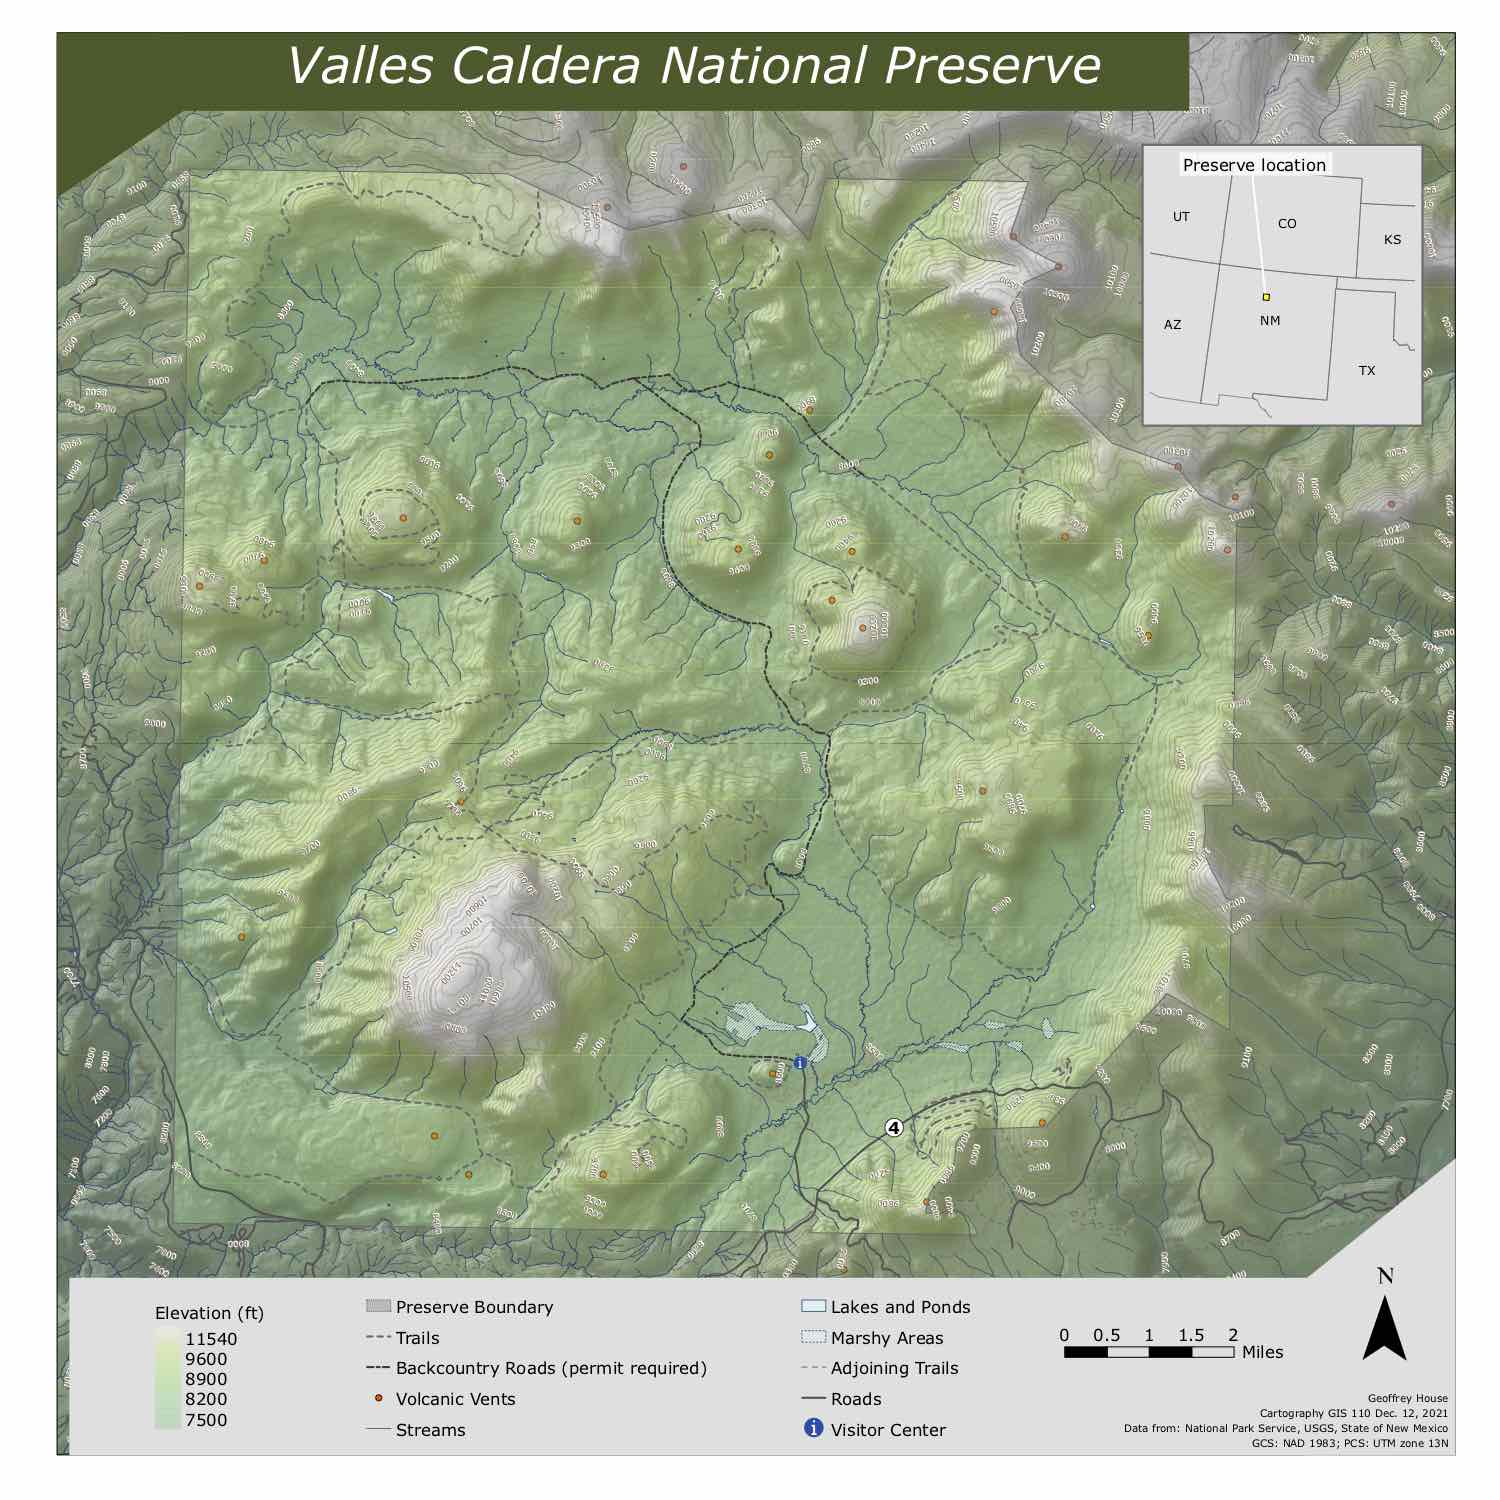
Maps and surface models from drone-collected imagery
Made using WebODM drone mapping software and JavaScript's Leaflet library
Variety of maps and digital surface models made using photographs taken by a drone in several locations to demonstrate its capabilities.
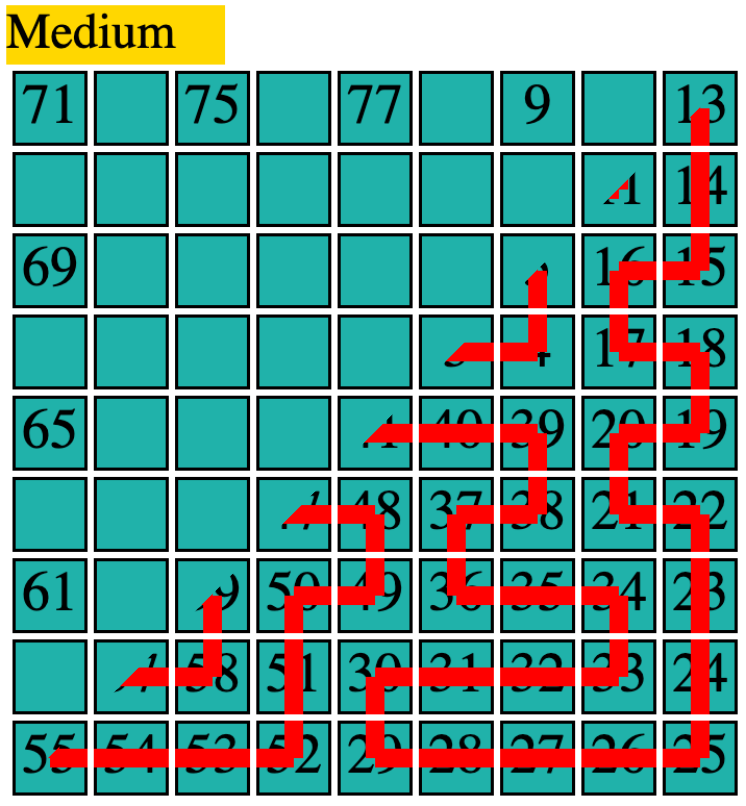
NumberPath
Made using JavaScript
Fill in the grid with consecutive numbers from 1 to 81 (no diagonals allowed), using the pre-filled numbers as a guide. If you're stuck, you can toggle the answer as a trace through the grid.